Working with Rasters
Making Rasters from Geometries
Turn geometric shapes into geo-registered raster images.
from odc.geo.data import ocean_geom
from odc.geo.xr import rasterize

display(ocean_geom())
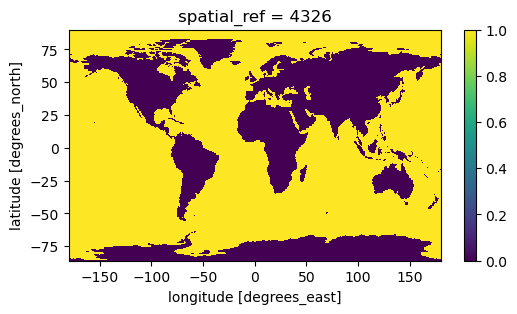
xx = rasterize(ocean_geom(), 0.5)
_ = xx.plot.imshow(aspect=2, size=3)

Creating PNG Images
Use
odc.geo.xr.colorize()to turn data into RGBA image, matplotlib colormaps are supportedUse
odc.geo.compress()to generate PNG dataWe then display it with
IPython.display.Image, but one can save to a file or send to an HTTP client from an API.
from odc.geo.data import country_geom
from odc.geo.xr import rasterize
from IPython.display import Image

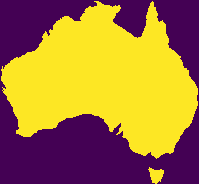
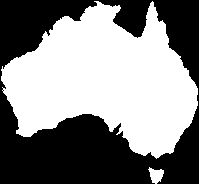
xx = rasterize(country_geom("AUS", "epsg:3577"), 20_000)
display(Image(data=xx.odc.colorize().odc.compress()))
display(Image(data=xx.odc.colorize('bone').odc.compress()))


Plotting on a map
import folium
import xarray as xr
from numpy.random import uniform
from odc.geo.data import country_geom
from odc.geo.xr import rasterize

# Make some sample images
def gen_sample(iso3, crs="epsg:3857", res=60_000, vmin=0, vmax=1000):
   xx = rasterize(country_geom(iso3, crs), res)
   return xr.where(xx, uniform(vmin, vmax, size=xx.shape), float("nan")).astype("float32")

aus, png, nzl = [gen_sample(iso3) for iso3 in ["AUS", "PNG", "NZL"]]

# Create folium Map (ipyleaflet is also supported)
m = folium.Map()

# Plot each sample image with different colormap
aus.odc.add_to(m, opacity=0.5)
png.odc.add_to(m, opacity=0.5, cmap="spring", robust=True)   # vmin=2%,vmax=98%
nzl.odc.add_to(m, opacity=0.5, cmap="jet", vmin=0, vmax=800) # force vmin/vmax

# Zoom map to Australia
m.fit_bounds(aus.odc.map_bounds())
display(m)
Make this Notebook Trusted to load map: File -> Trust Notebook
Saving Data
Use odc.geo.xr.write_cog() to generate cloud optimized GeoTIFF images. There is also
in-memory version odc.geo.xr.to_cog() that returns compressed image bytes, useful for
uploading data to the cloud storage.